loudness_zwst_freq#
- loudness_zwst_freq(spectrum, freqs, field_type='free')[source]#
Compute the loudness value from a fine band spectrum
This function computes the acoustic loudness according to Zwicker method for stationary signals (ISO.532-1:2017).
- Parameters:
spectrum (array_like) – A RMS spectrum.
freqs (array_like) – Frequency axis.
field_type ({'free', 'diffuse'}) – Type of soundfield. Default is ‘free’
- Returns:
N (float or array_like) – Overall loudness array in [sones], size (Ntime,).
N_specific (array_like) – Specific loudness array [sones/bark], size (Nbark, Ntime).
bark_axis (array_like) – Bark axis array, size (Nbark,).
Warning
The sampling frequency of the signal must be >= 48 kHz to fulfill requirements. If the provided signal doesn’t meet the requirements, it will be resampled.
See also
loudness_zwstLoudness computation for a stationary time signal
loudness_zwst_persegLoudness computation by time-segment
loudness_zwtvLoudness computation for a non-stationary time signal
Notes
The total loudness \(N\) is computed as the integral of the specific loudness \(N'\) measured in sone/bark, over the Bark scale. The values of specific loudness are evaluated from third octave band levels as function of critical band rate \(z\) in Bark.
\[N=\int_{0}^{24Bark}N'(z)\textup{dz}\]Due to normative continuity, the method is in accordance with ISO 226:1987 equal loudness contours instead of ISO 226:2003, as defined in the following standards:
ISO 532:1975 (method B)
DIN 45631:1991
ISO 532-1:2017 (method 1)
References
[1]E.Zwicker and H.Fastl. Program for calculating loudness according to din 45631 (iso 532b). Journal of the Acoustical Society of Japan, 1991. URL: https://www.jstage.jst.go.jp/article/ast1980/12/1/12_1_39/_article.
[2]ISO.532-1:2017. Methods for calculating loudness, part 1 Zwicker Method. International Organization for Standardization, 2017. URL: https://www.iso.org/standard/63077.html.
Examples
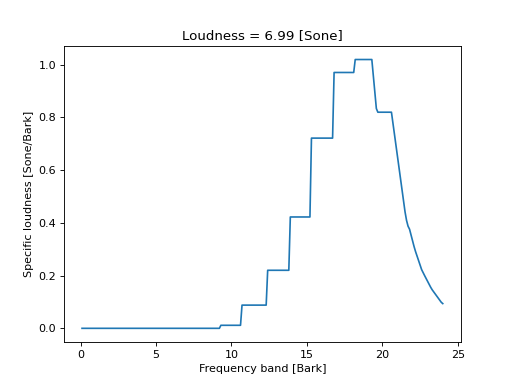
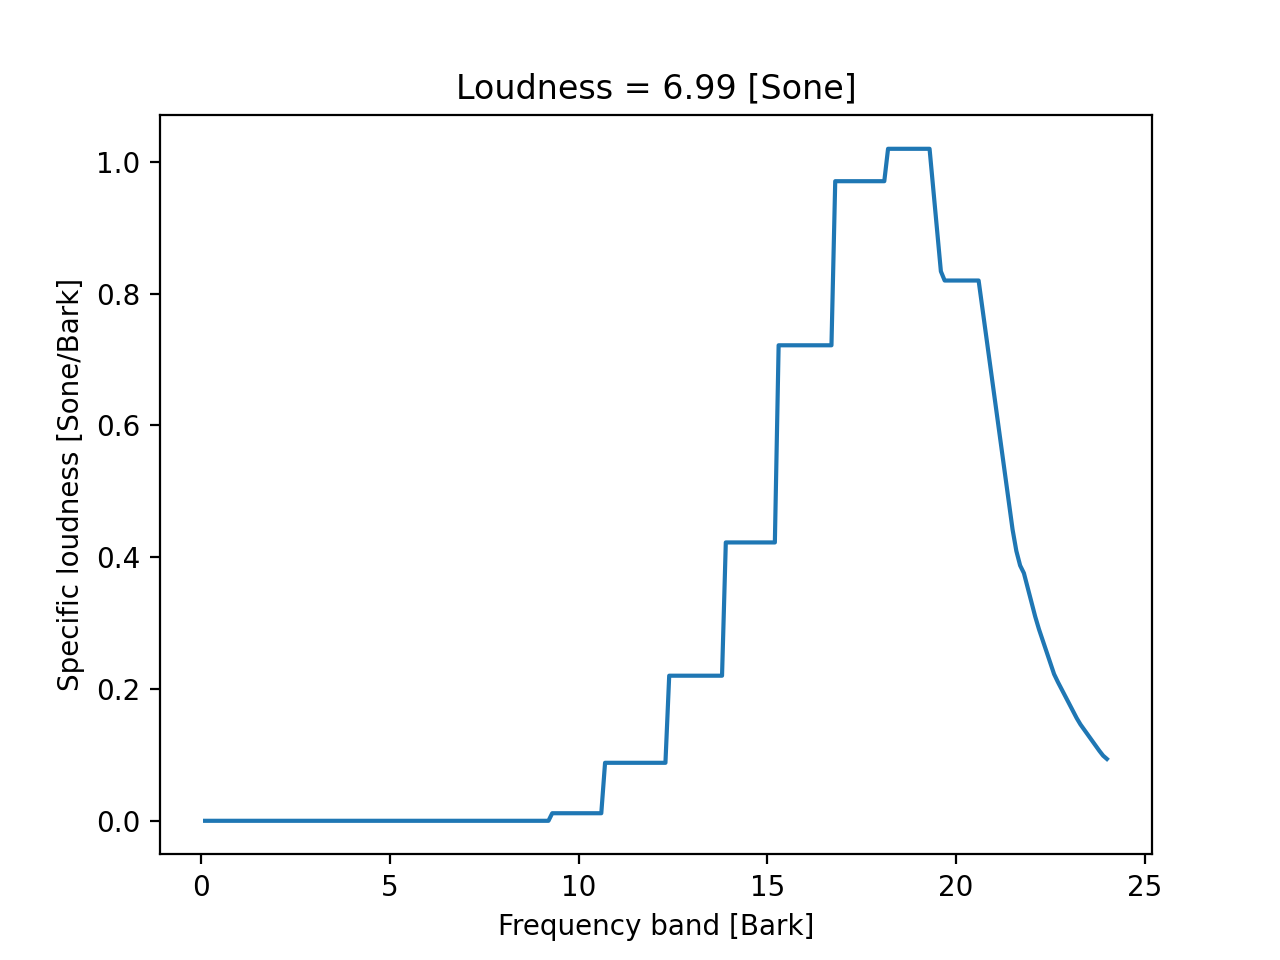
>>> from mosqito.sq_metrics import loudness_zwst_freq
>>> from mosqito.sound_level_meter import comp_spectrum
>>> import matplotlib.pyplot as plt
>>> import numpy as np
>>> fs=48000
>>> d=0.2
>>> dB=60
>>> time = np.arange(0, d, 1/fs)
>>> f = np.linspace(1000,5000, len(time))
>>> stimulus = 0.5 * (1 + np.sin(2 * np.pi * f * time))
>>> rms = np.sqrt(np.mean(np.power(stimulus, 2)))
>>> ampl = 0.00002 * np.power(10, dB / 20) / rms
>>> stimulus = stimulus * ampl
>>> spec, freqs = comp_spectrum(stimulus, fs, db=False)
>>> N, N_spec, bark_axis = loudness_zwst_freq(spec, freqs)
>>> plt.plot(bark_axis, N_spec)
>>> plt.xlabel("Frequency band [Bark]")
>>> plt.ylabel("Specific loudness [Sone/Bark]")
>>> plt.title("Loudness = " + f"{N:.2f}" + " [Sone]")
(
Source code,png,hires.png,pdf)