loudness_ecma#
- loudness_ecma(signal, fs, sb=2048, sh=1024)[source]#
Calculation of the specific and total loudness according to ECMA-418-2 (2nd Ed, 2022), Section 5.
This function computes the acoustic loudness according to ECMA-418-2 section 5 method for stationary signals.
- Parameters:
signal (numpy.array) – Signal time values [Pa]. The sampling frequency of the signal must be 48000 Hz.
sb (int or list of int) – Block size.
sh (int or list of int) – Hop size.
- Returns:
N (float) – Overall loudness representative value [sone_HMS].
N_time (numpy.ndarray) – Loudness over time [sone_HMS], size (Ntime,).
N_specific (numpy.ndarray) –
- Specific loudness [sone_HMS/bark], size (Nbark, Ntime).
Each of the 53 elements of the list corresponds to the time-dependant specific loudness for a given bark band. Can be a ragged array if a different sb/sh are used for each band.
bark_axis (numpy.ndarray) – Corresponding bark axis, size (Nbark,).
time_array (numpy.ndarray) – Time axis, size (Nbark, Ntime).
Warning
The sampling frequency of the signal must be 48 kHz.
See also
loudness_zwstZwicker and Fastl loudness computation for a stationary time signal
loudness_zwtvZwicker and Fastl loudness computation for a non-stationary time signal
References
[1]ECMA.418-2:2022. Psychoacoustic metrics for ITT equipment — Part 2 (models based on human perception). European Computer Manufacturers Association, 2022. URL: https://www.ecma-international.org/wp-content/uploads/ECMA-418-2_2nd_edition_december_2022.pdf?trk=organization_guest_main-feed-card_reshare-text.
Examples
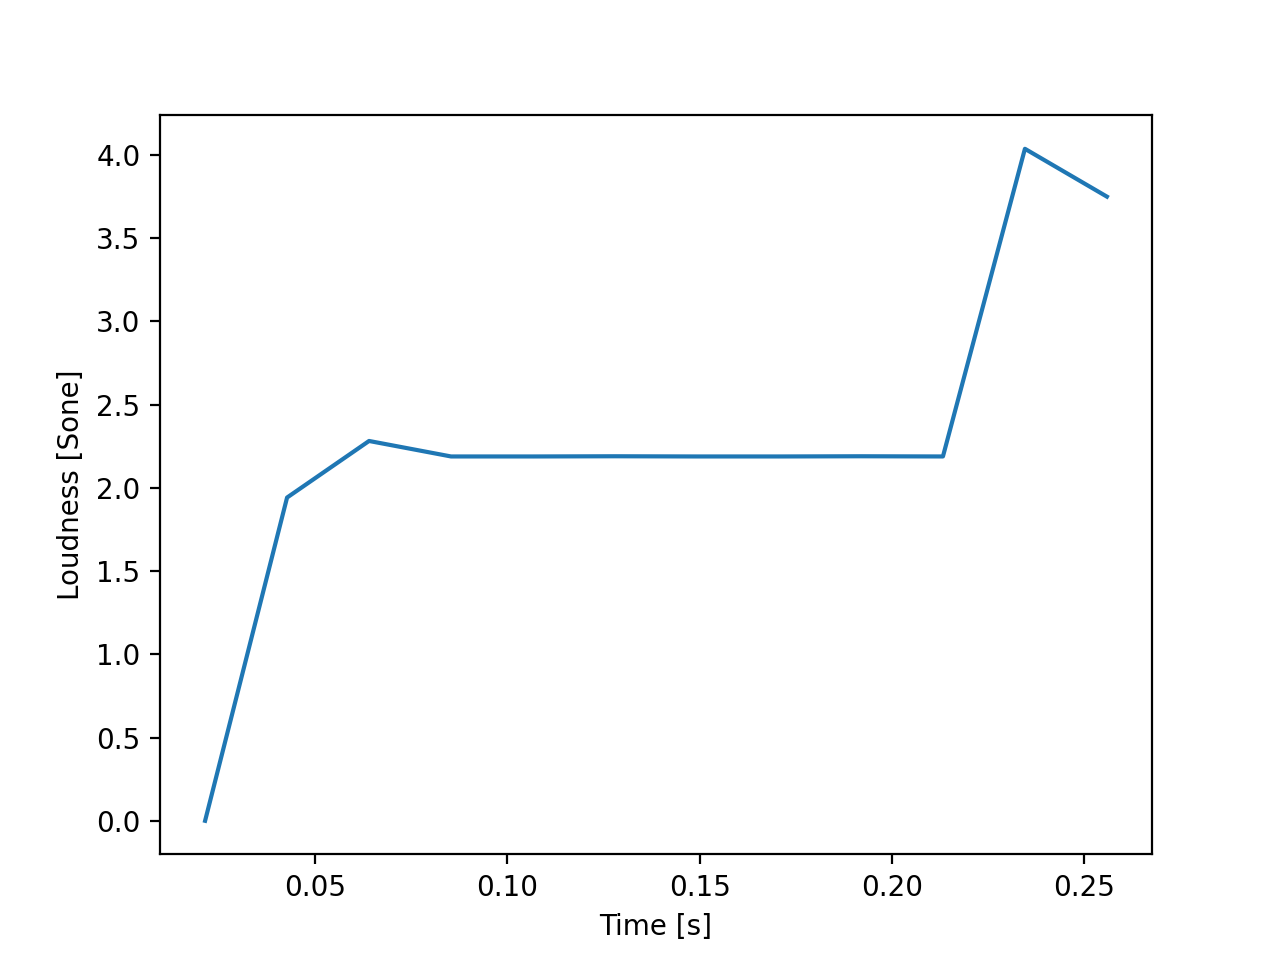
>>> from mosqito.sq_metrics import loudness_ecma
>>> import matplotlib.pyplot as plt
>>> import numpy as np
>>> f=1000
>>> fs=48000
>>> d=0.2
>>> dB=60
>>> time = np.arange(0, d, 1/fs)
>>> stimulus = 0.5 * (1 + np.sin(2 * np.pi * f * time))
>>> rms = np.sqrt(np.mean(np.power(stimulus, 2)))
>>> ampl = 0.00002 * np.power(10, dB / 20) / rms
>>> stimulus = stimulus * ampl
>>> N, N_time, N_spec, bark_axis, time_array = loudness_ecma(stimulus, fs)
>>> plt.plot(time_array[0], N_time)
>>> plt.xlabel("Time [s]")
>>> plt.ylabel("Loudness [Sone]")
(
Source code,png,hires.png,pdf)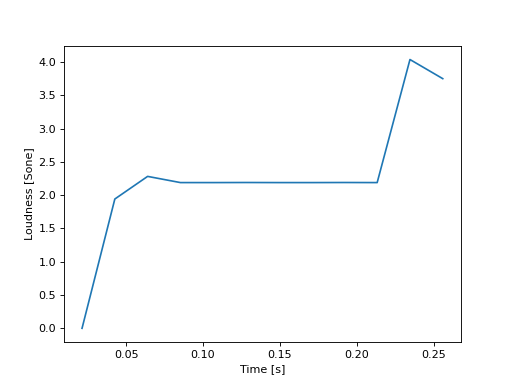