pr_ecma_freq#
- pr_ecma_freq(spectrum, freqs, prominence=True)[source]#
Compute the prominence ratio value from fine band spectrum (optionally segmented)
This function computes the prominence ratio according to ECMA 418-1 from a sound spectrum.
- Parameters:
spectrum (array_like) – Amplitude or complex frequency spectrum, dim(nperseg x nseg).
freqs (array_like) – Frequency axis dim(nperseg x nseg) or ([)nperseg).
prominence (Bool) – If True, the algorithm only returns the prominent tones, if False it returns all tones detected. Default to True
- Returns:
t_pr (float) – Global PR value.
pr (array of float) – PR values for each detected tone.
promi (array of bool) – Prominence criterion for each detected tone.
tones_freqs (array of float) – Frequency of the detected tones.
See also
tnr_ecma_freqTNR computation for a sound spectrum
pr_ecma_stProminence ratio for a stationary signal
pr_ecma_persegPR computation for a non-stationary signal
Notes
The computation is based on a spectrum analysis detecting peaks to be compared with the overall smoothed spectrum. The algorithm automatically detects the frequency of the tonal components according to Sottek’s method.
\[\Delta L_{TNR} = L_{peak} - 10\log_{10}\left (10^{0.1L_{peakband}} -10^{0.1L_{peak}}\right )\]\[\Delta L_{PR} = 10\log_{10}\left ( 10^{0.1L_{peakband}} \right ) - 10\log_{10}\left [0.5\left (10^{0.1L_{lowerband}} -10^{0.1L_{upperband}}\right )\right]\]The difference between PR and TNR lies in the comparison process between the peak level and the background noise amplitude. TNR compares the peak level to the level of its critical band, while PR compares the level of the peak’s critical band to its two neighbor bands. According to ECMA 74 standard, TNR can then prove to be more accurate for multiple tones in adjacent critical bands, for example when strong harmonics exist. PR can be more effective for multiple tones within the same critical band and is more readily automated to handle such cases.
Along with the TNR/PR value comes a prominence indicator, a tone being considered as prominent if its dB level is sufficiently higher than the smoothed spectrum, depending on its frequency.
References
[1]ECMA.418-2:2022. Psychoacoustic metrics for ITT equipment — Part 2 (models based on human perception). European Computer Manufacturers Association, 2022. URL: https://www.ecma-international.org/wp-content/uploads/ECMA-418-2_2nd_edition_december_2022.pdf?trk=organization_guest_main-feed-card_reshare-text.
Examples
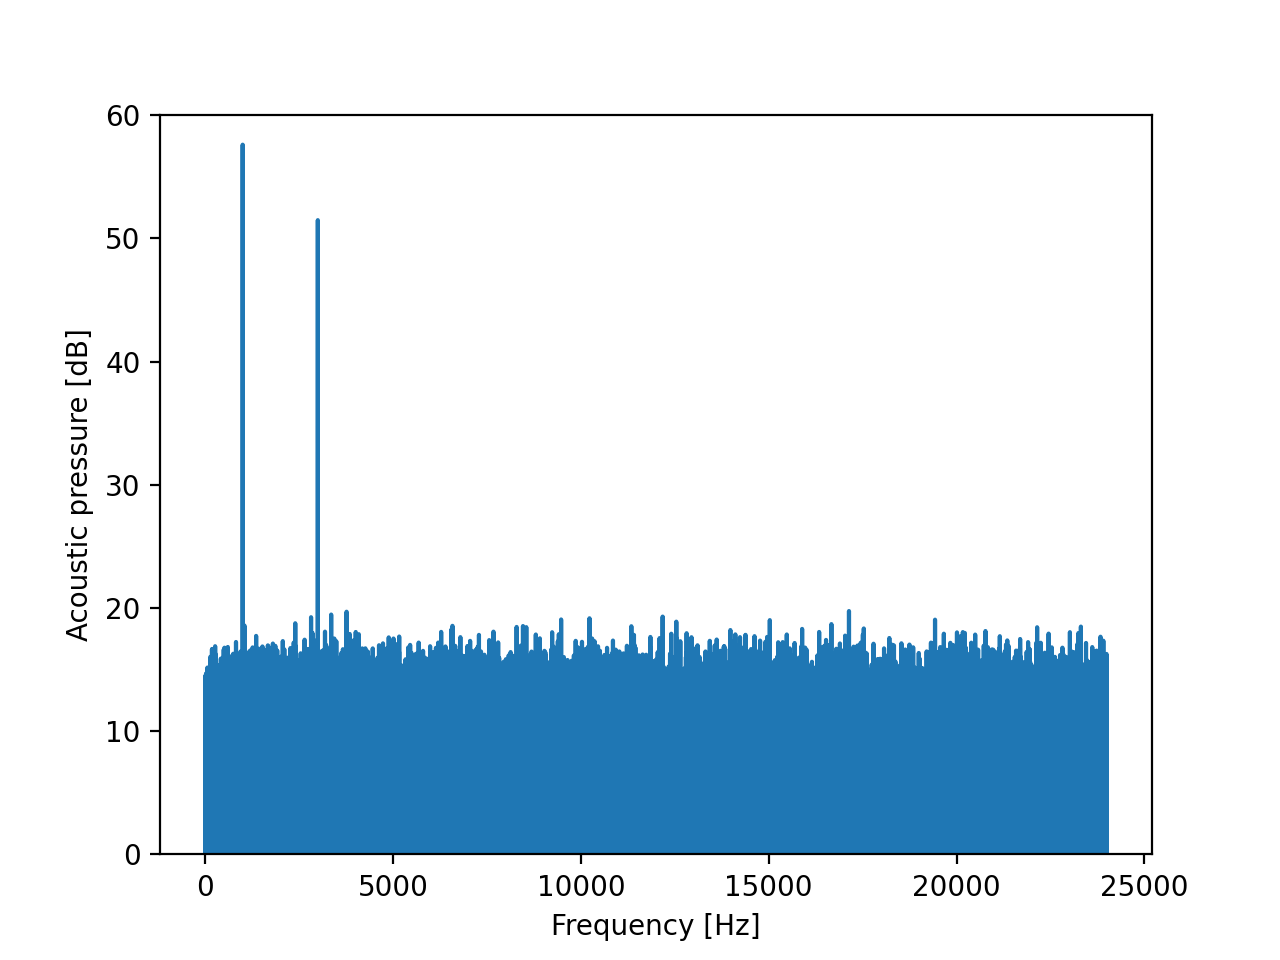
The example stimulus is made of white noise + 2 sine waves at 1kHz and 3kHz.
>>> import numpy as np
>>> import matplotlib.pyplot as plt
>>> from mosqito.sound_level_meter.comp_spectrum import comp_spectrum
>>> fs = 48000
>>> d = 2
>>> f = 1000
>>> dB = 60
>>> time = np.arange(0, d, 1/fs)
>>> stimulus = np.sin(2 * np.pi * f * time) + 0.5 * np.sin(2 * np.pi * 3 * f * time)+ np.random.normal(0,0.5, len(time))
>>> rms = np.sqrt(np.mean(np.power(stimulus, 2)))
>>> ampl = 0.00002 * np.power(10, dB / 20) / rms
>>> stimulus = stimulus * ampl
>>> spectrum_db, freq_axis = comp_spectrum(stimulus, fs, db=True)
>>> plt.plot(freq_axis, spectrum_db)
>>> plt.ylim(0,60)
>>> plt.xlabel("Frequency [Hz]")
>>> plt.ylabel("Acoustic pressure [dB]")
(
Source code,png,hires.png,pdf)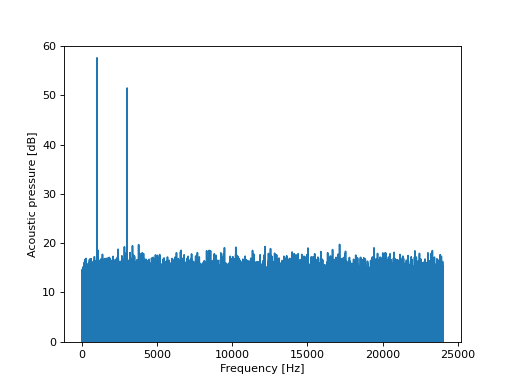
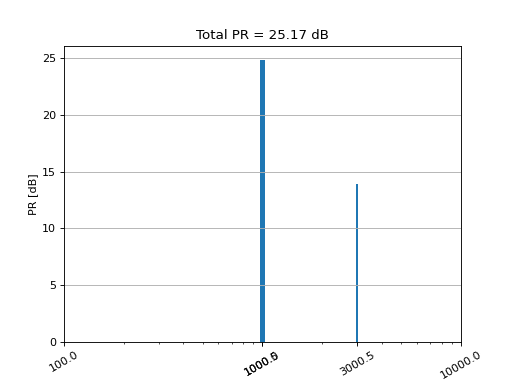
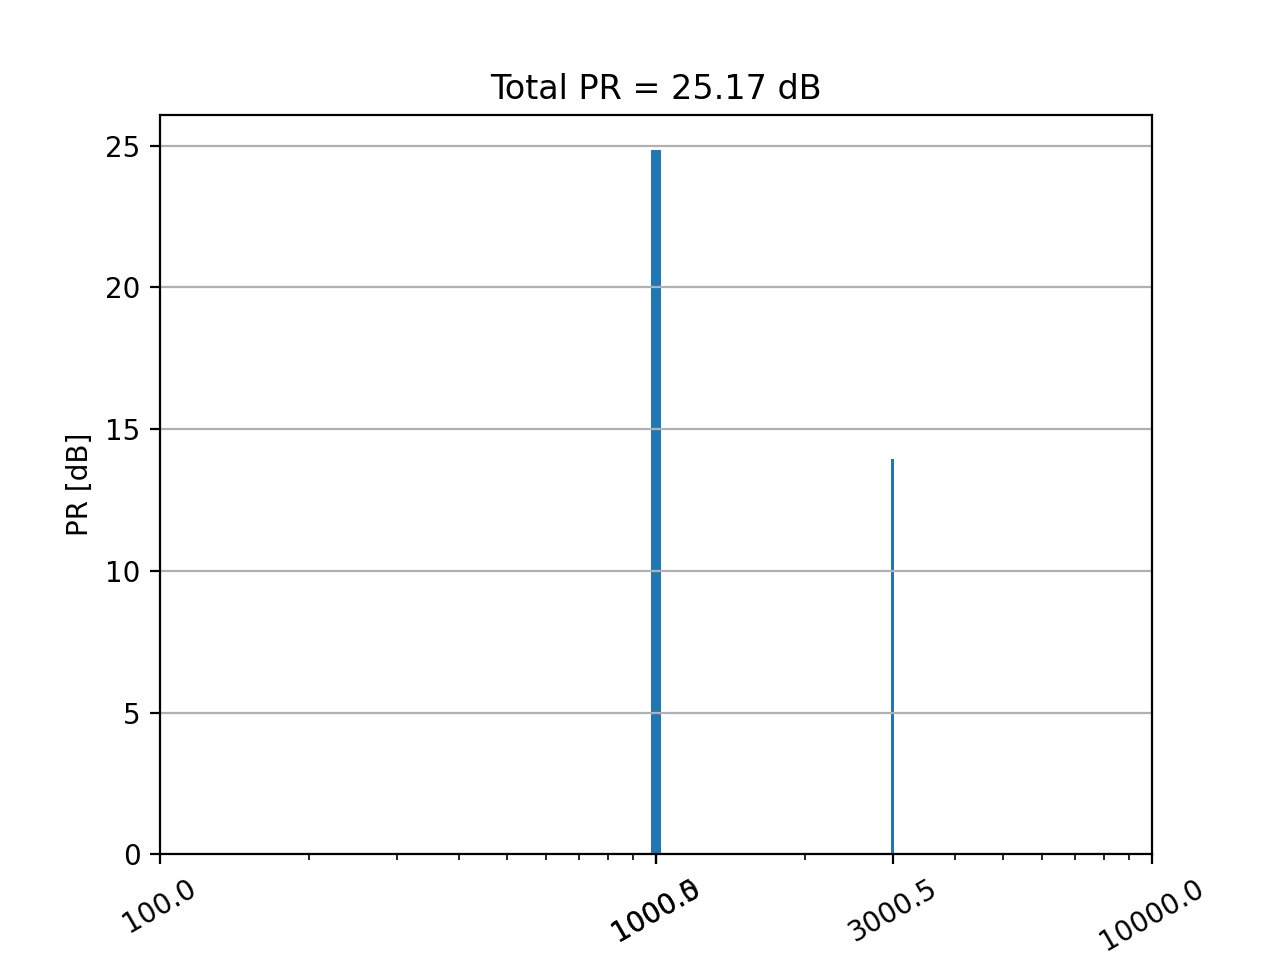
>>> import numpy as np
>>> import matplotlib.pyplot as plt
>>> from mosqito.sq_metrics import pr_ecma_freq
>>> from mosqito.sound_level_meter.comp_spectrum import comp_spectrum
>>> fs = 48000
>>> d = 2
>>> f = 1000
>>> dB = 60
>>> time = np.arange(0, d, 1/fs)
>>> stimulus = np.sin(2 * np.pi * f * time) + 0.5 * np.sin(2 * np.pi * 3 * f * time)+ np.random.normal(0,0.5, len(time))
>>> rms = np.sqrt(np.mean(np.power(stimulus, 2)))
>>> ampl = 0.00002 * np.power(10, dB / 20) / rms
>>> stimulus = stimulus * ampl
>>> spec, freq_axis = comp_spectrum(stimulus, fs, db=False)
>>> t_pr, pr, prom, tones_freqs = pr_ecma_freq(spec.T, freq_axis.T)
>>> plt.bar(tones_freqs, pr, width=50)
>>> plt.grid(axis='y')
>>> plt.ylabel("PR [dB]")
>>> plt.title("Total PR = "+ f"{t_pr[0]:.2f}" + " dB")
>>> plt.xscale('log')
>>> xticks_pos = list(tones_freqs) + [100,1000,10000]
>>> xticks_pos = np.sort(xticks_pos)
>>> xticks_label = [str(elem) for elem in xticks_pos]
>>> plt.xticks(xticks_pos, labels=xticks_label, rotation = 30)
>>> plt.xlabel("Frequency [Hz]")
(
Source code,png,hires.png,pdf)