noct_spectrum#
- noct_spectrum(sig, fs, fmin, fmax, n=3, G=10, fr=1000)[source]#
Compute nth-octave band spectrum
This function computes the rms level of a signal for each third octave band between the 2 limit frequencies.
- Parameters:
sig (array_like) – Time signal array with size (nperseg, nseg).
fs (float) – Sampling frequency [Hz]
fmin (float) – Minimum frequency band [Hz]
fmax (float) – Maximum frequency band [Hz]
n (int) – Number of bands per octave
G (int) – System for specifying the exact geometric mean frequencies. Can be base 2 or base 10
fr (int) – Reference frequency. Shall be set to 1 kHz for audible frequency range, to 1 Hz for infrasonic range (f < 20 Hz) and to 1 MHz for ultrasonic range (f > 31.5 kHz)
- Returns:
spec (array_like) – nth-octave octave band spectrum of signal sig with size (nfreq, nseg)
fpref (array_like) – Corresponding prefered nth-octave octave band center frequencies
See also
comp_spectrumSpectrum computation from a time signal
noct_synthesisConversion of a spectrum to n-th octave band levels
Examples
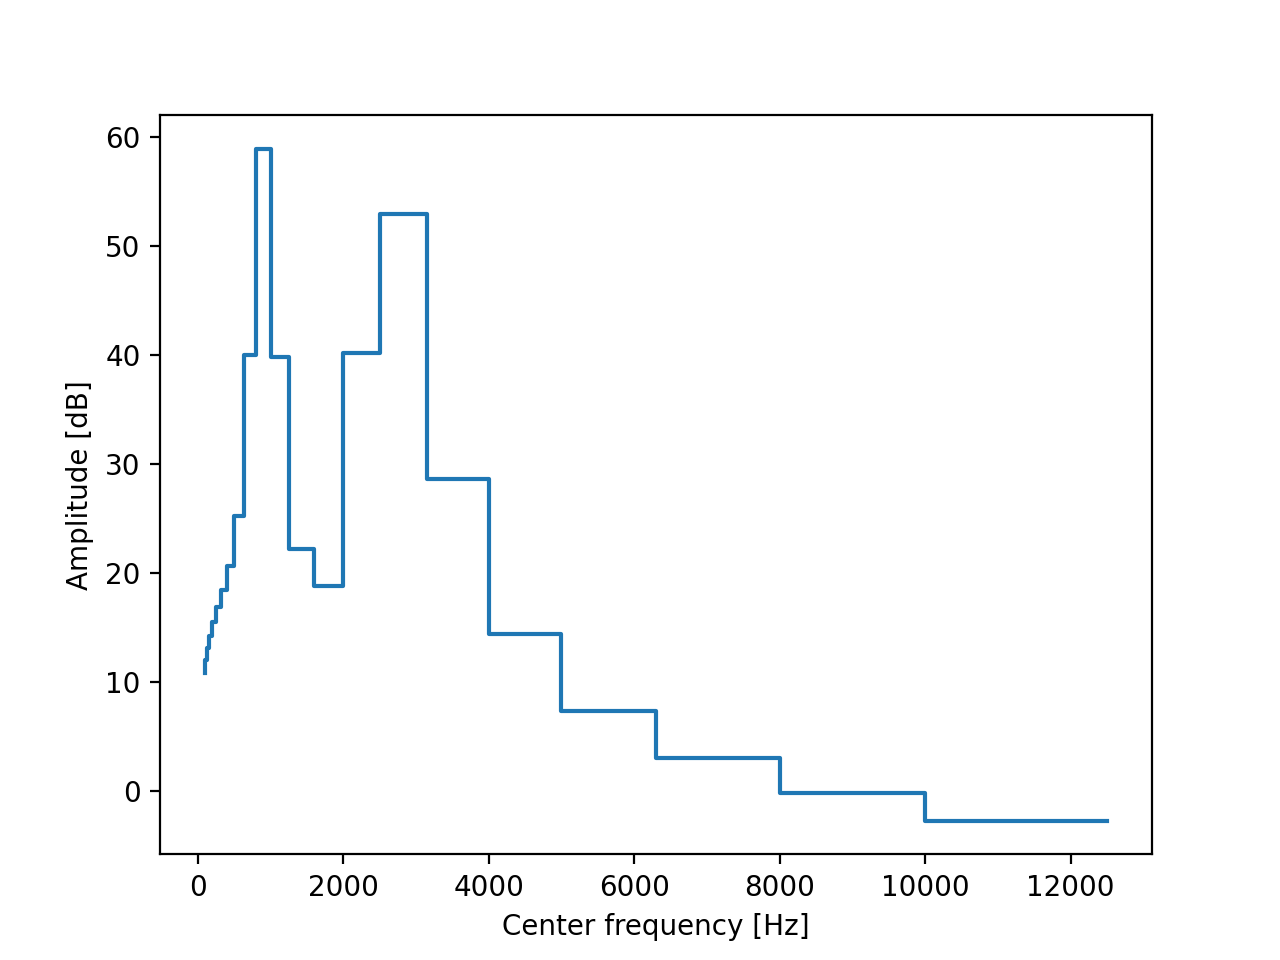
>>> from mosqito.sound_level_meter import noct_spectrum
>>> from mosqito.utils import amp2db
>>> import matplotlib.pyplot as plt
>>> import numpy as np
>>> f=1000
>>> fs=48000
>>> d=0.2
>>> dB=60
>>> time = np.arange(0, d, 1/fs)
>>> stimulus = np.sin(2 * np.pi * f * time) + 0.5 * np.sin(6 * np.pi * f * time)
>>> rms = np.sqrt(np.mean(np.power(stimulus, 2)))
>>> ampl = 0.00002 * np.power(10, dB / 20) / rms
>>> stimulus = stimulus * ampl
>>> spec, freq_axis = noct_spectrum(stimulus, fs, fmin=90, fmax=14000)
>>> spec_db = amp2db(spec, ref=2e-5)
>>> plt.step(freq_axis, spec_db)
>>> plt.xlabel("Center frequency [Hz]")
>>> plt.ylabel("Amplitude [dB]")
(
Source code,png,hires.png,pdf)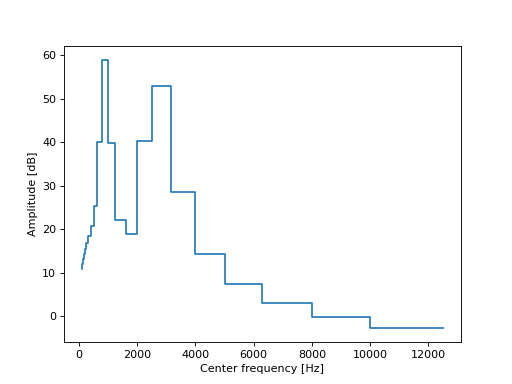