comp_spectrum#
- comp_spectrum(signal, fs, nfft='default', window='hanning', one_sided=True, db=True)[source]#
Compute one-sided spectrum from a time signal in Pa.
- Parameters:
signal (array) – A time signal (nperseg x nseg).
fs (integer) – Sampling frequency.
db (boolean, optional) – Indicates if the spectrum is in dB values. Default is True.
- Returns:
spectrum (array) – Spectrum (freq_axis x nseg).
freq_axis (array) – Frequency axis.
See also
noct_synthesisConversion of a spectrum to n-th octave band levels
noct_spectrumN-th octave band spectrum computation from a time signal
spectrum2dBAConversion of a spectrum from dB to dBA
Examples
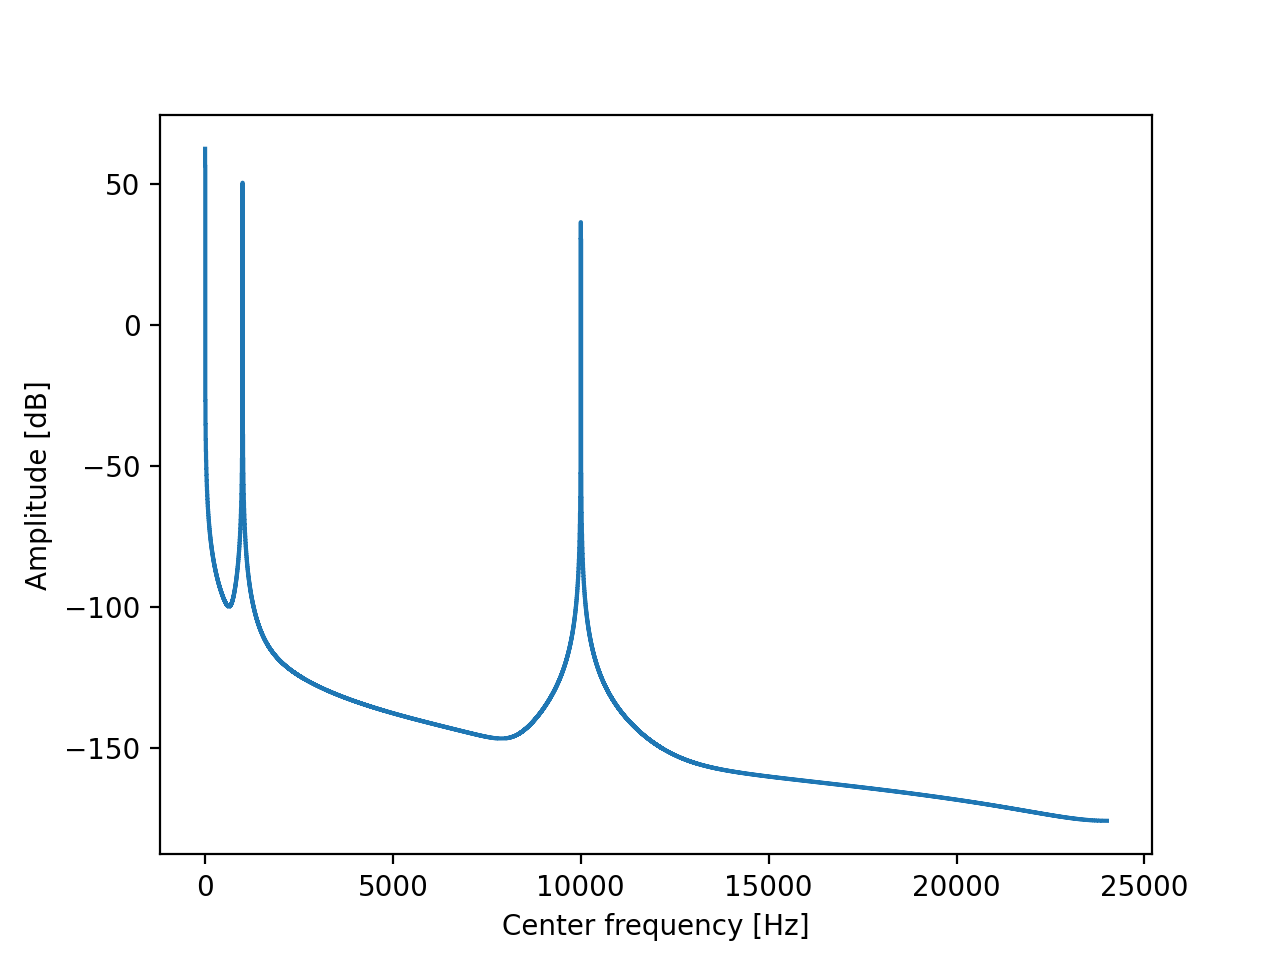
>>> from mosqito.sound_level_meter import comp_spectrum
>>> import matplotlib.pyplot as plt
>>> import numpy as np
>>> fs=48000
>>> d=0.2
>>> dB=60
>>> time = np.arange(0, d, 1/fs)
>>> f = 1000
>>> stimulus = 1 + 0.5*np.sin(2 * np.pi * f * time) + 0.1*np.sin(20 * np.pi * f * time)
>>> rms = np.sqrt(np.mean(np.power(stimulus, 2)))
>>> ampl = 0.00002 * np.power(10, dB / 20) / rms
>>> stimulus = stimulus * ampl
>>> spec_db, freq_axis = comp_spectrum(stimulus, fs, db=True)
>>> plt.step(freq_axis, spec_db)
>>> plt.xlabel("Center frequency [Hz]")
>>> plt.ylabel("Amplitude [dB]")
(
Source code,png,hires.png,pdf)